5dchart Add-In (for MS Excel)
| Infocard
| ||||||||||||||||
| ||||||||||||||||
Create 3D bubble charts and 3D scatter plots
|
| 6.42 Mb |
Contents
Description by the Publisher
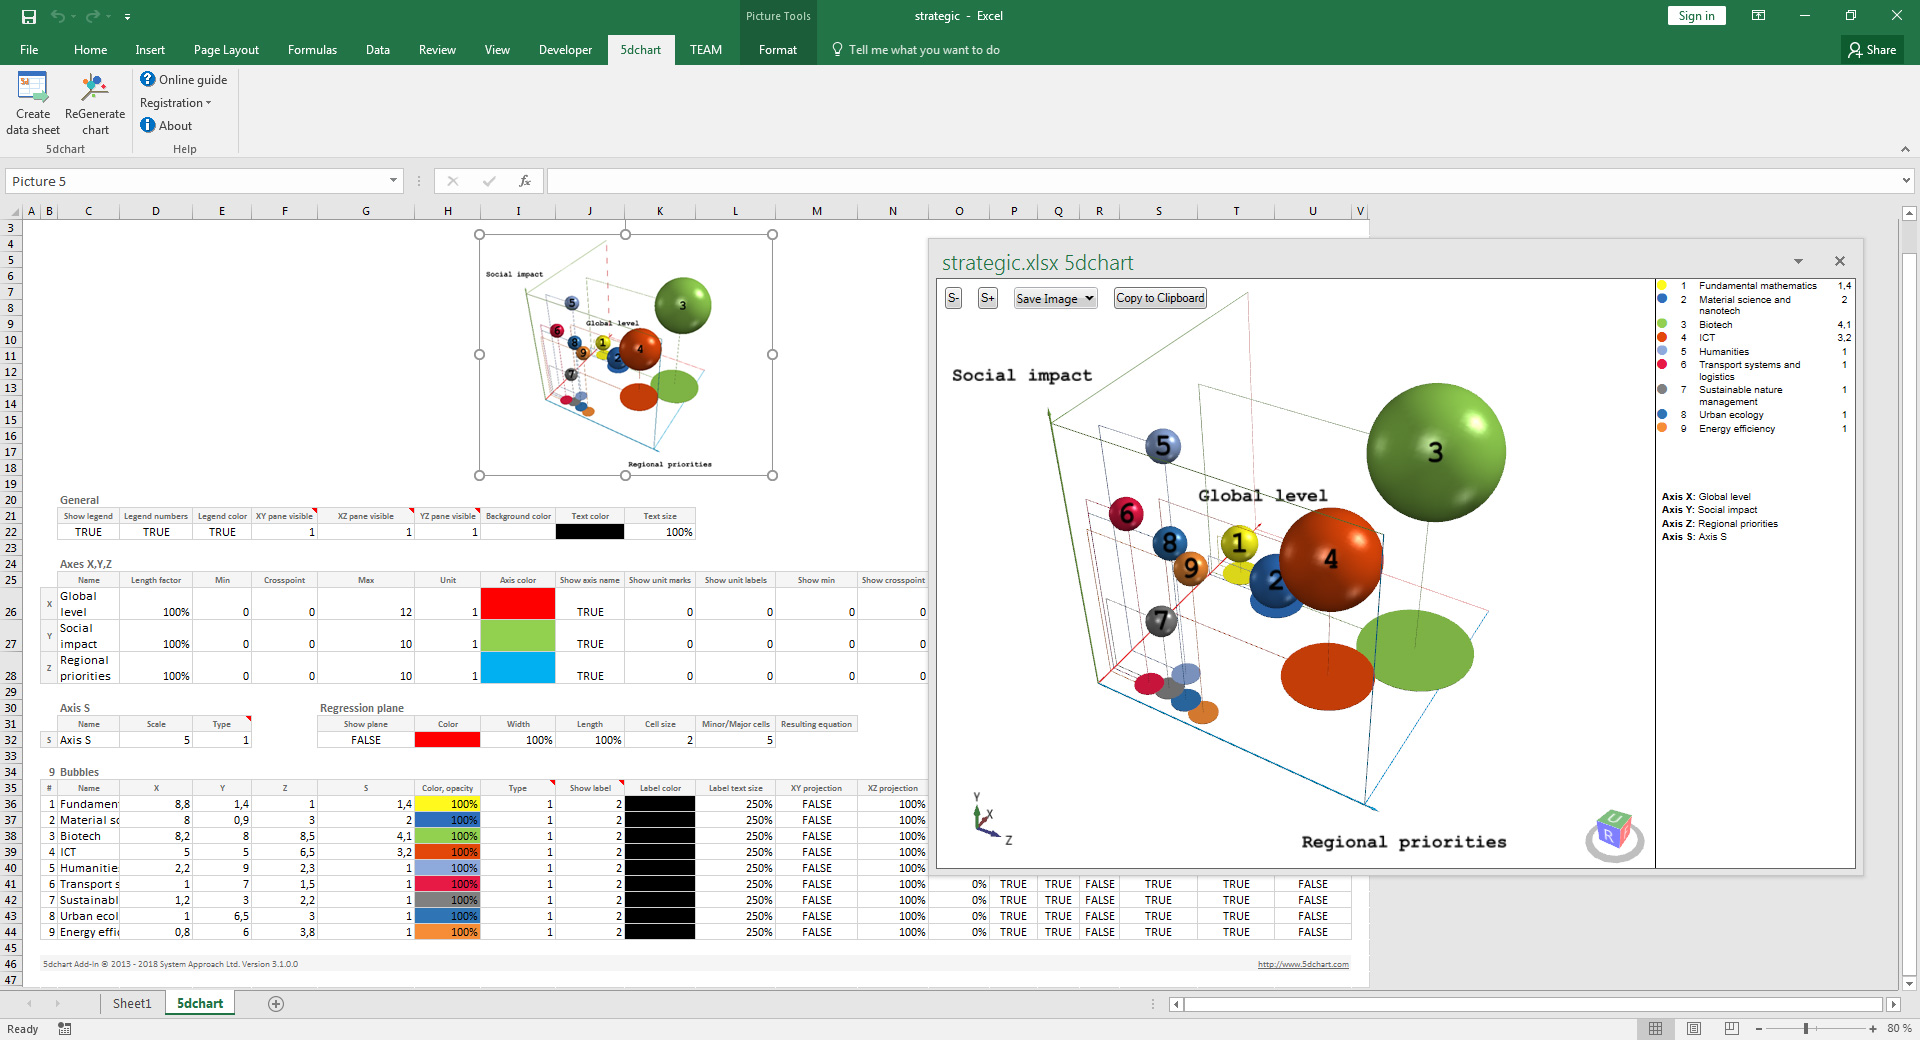
Create stunning 3D bubble charts in Excel with 5dchart Add-In! 5dchart Add-In for Microsoft Excel is an easy-to-use tool for multi-dimensional data visualization. It allows you to display a 3D bubble chart with two additional parameters: 3D coordinates of each bubble and bubble size and colour. Of course, it is the easy way to create 3D scatter plot too. Also you can compute the best fit plane equation using least squares and display a 3D regression plane easily! 5dchart Add-In is designed to allow 3D charts drawing directly in Microsoft Excel without using any standalone applications. We believe it's one of the most sophisticated 3D bubble chart drawing tools for Microsoft Excel.
Limitations in the Downloadable Version
Watermarked background on the chart, disabled high resolution image export
Product Identity
Unique Product ID: PID-F4001A1AAC19
Unique Publisher ID: BID-E4001A1AAC19
[5dchart Add-In (for MS Excel) PAD XML File]
